Super Bowl is coming up so it’s a good time to share about a football-themed exponential investigation we did this semester. Full details below, including links to the task sheets.
I had come across some work by Geoff and Mr. Honner and was totally inspired by the awesome math behind the NFL Draft. I had never given a lot of thought to all of the calculations that underpin the trades that take place each year and once I got into the numbers I knew I wanted to bring it to the classroom.
For those (like me) that don’t follow football closely, the basic idea is that every year the NFL holds a player draft, where each team has the chance to on-board new players. There are a number of rounds, and each team is allotted a number of a set of picks throughout the various rounds. The order of the picks is determined by how teams fared in the previous NFL season. (If you come in last, you get first pick).
The interesting part, from a math perspective, is that teams do quite a lot of trading with their picks. A team might wish to trade up, to get a pick earlier in a round, for instance. In order to do this, they have to trade off a few of their lower pick rounds.
In order to facilitate the trades, the NFL has produced a trade value chart, that identifies a point value for each of the picks. That way, if a team wants to trade for the 12th pick, they can sort out which trades they can provide for an equal value. The cool part? The chart is exponential!
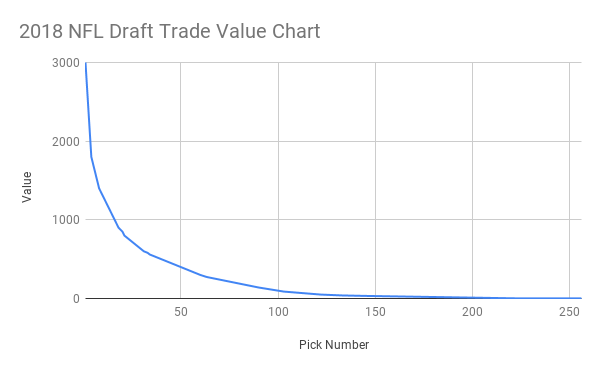
In our class, we went a similar route to Geoff. I had students plot the Trade Value Chart and practice identifying the key features of an exponential function. From there, we looked at all of the trades made in the 2018 Draft. I went through every trade made in the 2018 Draft and compiled it in a Google Sheet. I
Note: I included trades that involved last year’s spots because I thought it made it interesting. For example, one team traded their first pick in 2017 (12th) for the other team’s first pick in 2017 (25th) & their first pick in 2018 – an unknown! Turned out to be an excellent trade from the value perspective because the other team’s first pick in 2018 was 4th. However, you could remove the multi-year trades if you wanted. I omitted any trades that included a previously drafted player.
Students filled in the total value of each trade for the team that traded up & the team that traded down. They then had to plot the value of the trade ups vs. the trade downs to see whether teams adhered to the value chart – essentially is it a linear function?
I definitely didn’t execute on this idea perfectly, but I liked the concept for a bunch of reasons:
- Spreadsheets are awesome tools and too few students know how to navigate them.
- There is SO much math here. Think of the math involved just to figure out what trades you have to offer & what combination of those trades will yield the trade you want to make.
- Conversations around using math to make real-life decisions!
- More than one kind of function (linear & exponential) in one task is always a bonus.
- There are great conversations to be had about the outliers – why would someone trade away a higher pick for a lower one? Why are teams sometimes willing to trade for something with far less value?
You can check out the materials I drafted (ha!) up here, and please send your feedback my way:
NFL Draft Pick – Intro doc & questions